Group Health
Group health helps determine whether an API issue is an isolated request failure or a concentrated issue in a plan, model, upstream group, or team member. Enterprise and team admins can use it to answer three questions quickly:
- Which group has a lower success rate in the selected time range
- Which user or token contributes most of the request volume, cost, or errors
- Whether the error is isolated to one token or already affects the whole group
When troubleshooting API errors, check group health first, then open the single usage log entry to locate the specific request_id.
Data scope
The public status page embedded here queries group health across all aicentos users during the selected time window. It reflects platform-wide group availability and is real-time, impartial, and stable.
The Usage Logs -> Group Health view inside the console counts data visible under the current account permissions. Personal users usually see only their own tokens; enterprise and team admins can review team usage by user, username, token, and group.
If the status page above does not load correctly, open aicentos Group Health directly.
Console entry: Console -> Usage Logs. In error logs or statistics views, filter by time range, model, token, group, error message, and status code.
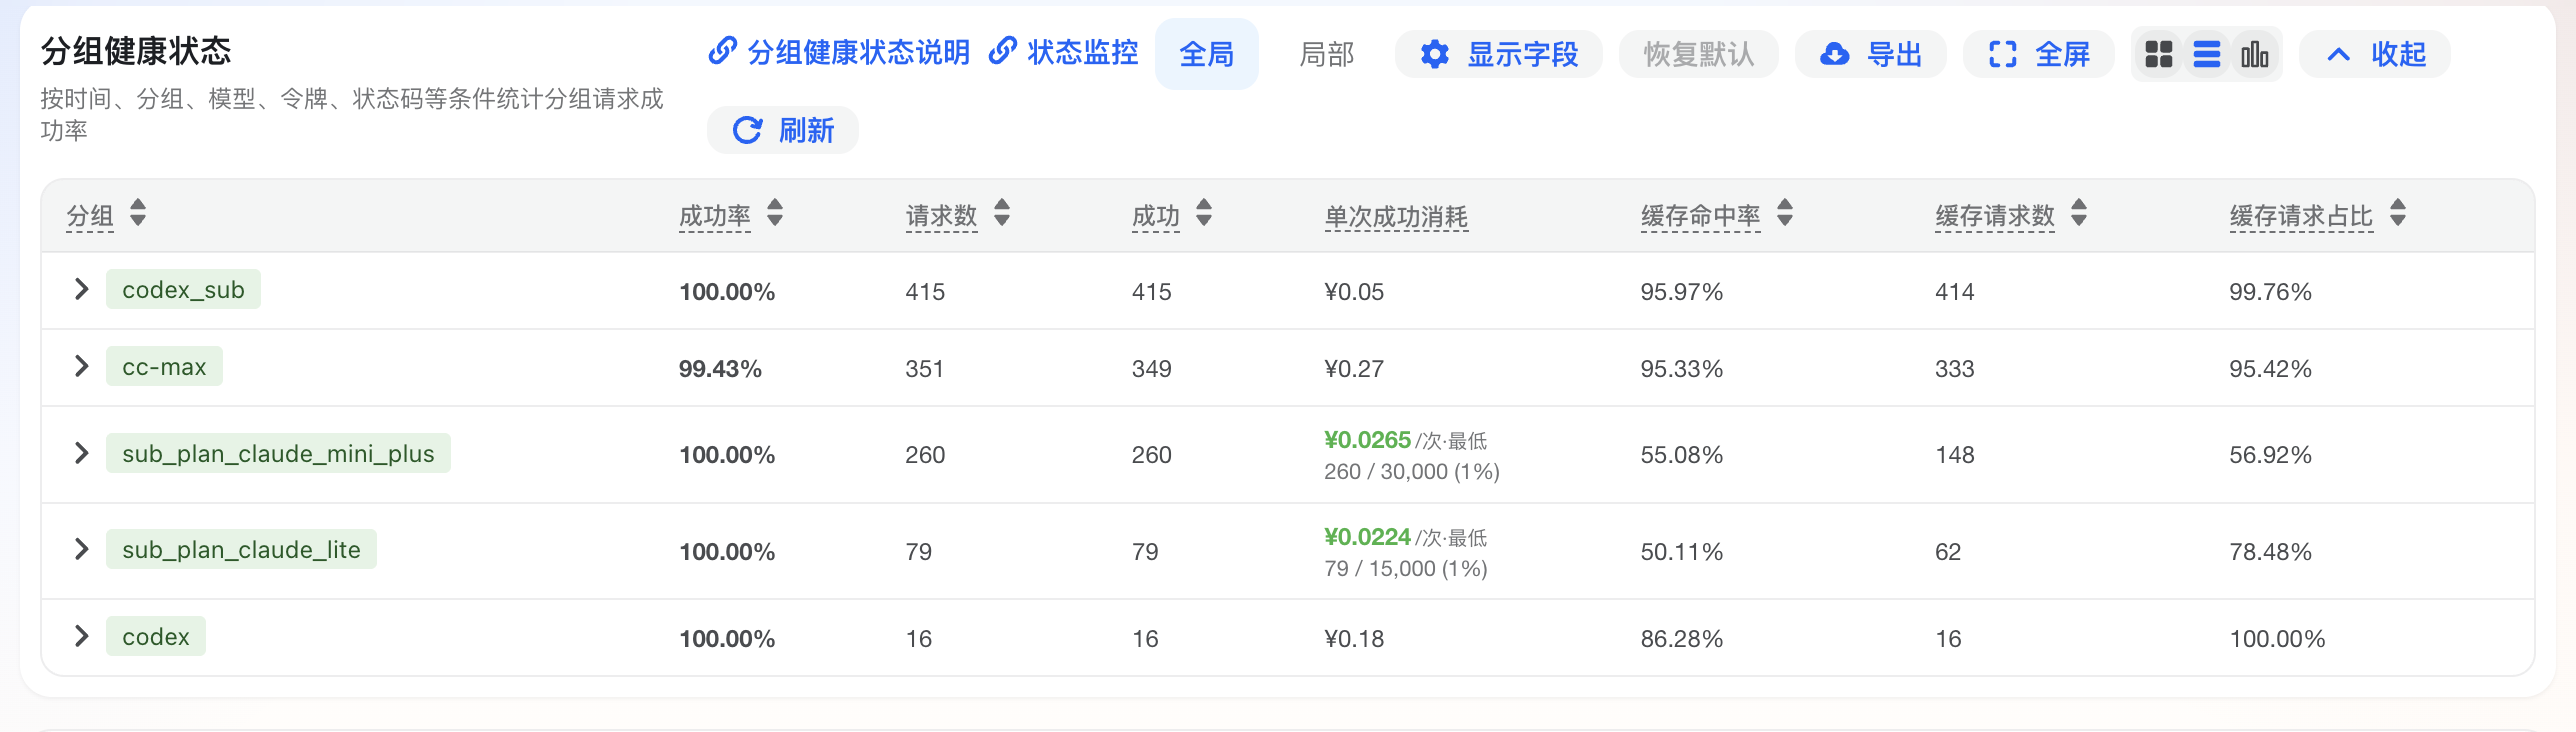
Console Example
The screenshot below shows Usage Logs -> Group Health in the console, including group success rate, request count, cost, cache hit data, average latency, latest request time, and failure reasons.
Usage principle
Identify the impact scope first, then handle the single error. A single log entry is best for locating one request; group health is best for determining whether the issue is concentrated.
For single error message explanations, see Error Logs.
List Columns
The console list and CSV export use the same display columns. The list contains two row types:
- Group row: summarizes the overall health of one group in the selected time range.
- Token row: shows user and token details under a group, which helps enterprise and team admins locate members, projects, or services.
| Display column | Applies to | Description | How to use it |
|---|---|---|---|
| Type | Group row, token row | Identifies whether the row is a Group summary or a Token detail | Check group rows first for overall status, then token rows for a member or token |
| Group | Group row, token row | Groups seen in the selected time range, including pay-as-you-go groups, plan groups, default groups, or model-specific groups | Check whether the issue is concentrated in one plan, model, or upstream resource pool |
| User ID | Token row | User ID that used the token | Use it to locate the member account in enterprise troubleshooting |
| Username | Token row | Username that used the token | Use it for team reports, member communication, and permission checks |
| Token | Token row | Token name configured in the console | Check whether the issue is isolated to one token |
| Success Rate | Group row, token row | Success Rate = successful requests / total requests | Pay attention when it is below 80%; if it is clearly lower than peer rows, check that group or token first |
| Requests | Group row, token row | Total request count in the selected time range | Avoid over-reading success rate when the sample size is small |
| Success | Group row, token row | Successful requests that returned 2xx | Read it together with Requests and Errors to judge availability |
| Errors | Group row, token row | Requests that returned errors (4xx/5xx) | When errors rise, check Failure Reason and error logs first |
| Cost | Group row, token row | Accumulated quota/cost consumption in the selected time range, exported in console currency format | Use it for team cost accounting, project allocation, and abnormal cost detection |
| Cache Hit Rate | Group row, token row | Cache Hit Rate = cache-hit tokens / total tokens | Higher is cheaper; cache-hit parts are usually billed at a lower price or free |
| Cache Tokens | Group row, token row | Number of cache-hit tokens in the selected time range | This part is usually billed at a low discount, so more means more savings |
| Cache Requests | Group row, token row | Number of requests that hit cache at least once | Shows how many requests actually used cache |
| Cache Request Share | Group row, token row | Cache Request Share = cache-hit requests / total requests | Higher means more calls benefited from cache discounts |
| Avg Cache Tokens | Group row, token row | Average number of tokens per cache hit | Compare cache reuse efficiency across members, services, or groups |
| Avg Latency | Group row, token row | Average request latency in seconds | Lower means faster upstream response; when latency rises, check long context, long output, and tool chains |
| Start Time | Group row, token row | First time this group or token appeared in the current time range | Locate when the issue or traffic started |
| Latest Request | Group row, token row | Most recent time this group or token appeared in the current time range | Check whether the issue or traffic is still ongoing |
| Failure Reason | Group row | Top failure reasons by frequency, including status code and count; empty or - when there are no errors | Handle the most frequent error first; do not rely only on the latest log entry |
Field source
The display columns are generated from backend statistics. For day-to-day use, follow the console list and CSV export columns; only map them to raw field names when integrating an API or doing technical troubleshooting.
Team diagnosis
Check group rows first to decide whether it is a resource-pool issue, then check token rows to see whether a user or token caused it. If the group success rate is normal but one token has a high error rate, check that member's token, model name, client configuration, or request body first.
CSV Export
CSV export uses the same columns as the current list. It is suitable for enterprise and team weekly reports, cost allocation, incident reviews, and member usage reconciliation.
After exporting, you can preview the file with the online CSV viewer. It supports dragging or selecting a CSV file, and it can also parse pasted CSV text, which is useful for quickly checking columns and failure reasons.
| Export behavior | Description |
|---|---|
| Group row | Type is Group; User ID, Username, and Token are usually empty, representing the group summary |
| Token row | Type is Token; User ID, Username, and Token are shown, representing member or token details under the group |
| Currency format | Cost uses the console currency format, such as ¥905.48 |
| Percentage format | Success Rate, Cache Hit Rate, and Cache Request Share are exported as percentages |
| Number format | Large numbers may include thousands separators for direct reading or spreadsheet import |
| Time format | Start Time and Latest Request are exported as local time, making them easier to align with incident time |
| Failure Reason | Multiple high-frequency errors are merged and include occurrence counts at the end; empty or - when there are no errors |
Troubleshooting Flow
1. Determine the impact scope
Check rows where Type=Group first. If Success Rate is close to normal and Errors is low, it is usually a transient error. Copy the request_id from the single request and continue troubleshooting.
If one group's Success Rate is clearly lower than other groups, or Errors is concentrated, prioritize group-level checks for model, token, upstream account, plan permissions, and platform resource status.
In enterprise or team scenarios, check the Type=Token rows under that group. If only one user or token is abnormal, check that member's client configuration, token, model name, request body, and concurrency strategy first.
2. Check top failure reasons
Failure Reason is usually sorted by occurrence count. Start with the most frequent error, then inspect lower-frequency errors. High-frequency errors show the main failure type in the current time range.
| Error type | Common log keywords | Initial attribution | What to check first |
|---|---|---|---|
| Rate limit | Account RPM limit exceeded, Max 10/min, Max 5/min | Usage issue or upstream limit | Concurrency or requests per minute are too high |
| Daily quota limit | Account daily limit exceeded | Upstream limit | Upstream account daily quota is exhausted |
| Credential cooldown | All credentials ... are cooling down | Upstream limit | All upstream credentials for the current model are cooling down |
| Request body too large | status_code=413, openai_error | Usage issue | Context, files, images, or tool results are too large |
| Permission or authentication | 401, 403, Invalid API key, pending admin approval | Usage issue or account status | Token, plan, group, or model permissions are abnormal |
| No available resource | No available accounts, No available channel, auth_unavailable | Platform issue or configuration issue | Current group has no available account, channel, or authentication resource |
| Upstream error | 502, all upstreams failed, Upstream request failed | Upstream issue | Upstream service or intermediate network is abnormal |
| Gateway timeout | 504, 521, 522, 524 | Upstream or network issue | Upstream connection, read, or response timed out |
| Platform resource protection | system disk overloaded, Service Unavailable | Platform issue | Platform node or upstream resource is temporarily unavailable |
| Image endpoint format | gpt-image-2, prompt is required, multipart form | Usage issue | Image endpoint path, prompt, or upload format is wrong |
| Tool-call format | tool_use, tool_result, Invalid schema | Usage issue | Client tool messages or JSON Schema do not meet requirements |
3. Handle by impact scope
| Symptom | More likely cause | What to do |
|---|---|---|
| Only one token fails | Token configuration, permission, or local request format issue | Copy the token again and check client configuration and request body |
| Only one model fails | Model permission, model channel, or upstream model resource issue | Switch to a similar model and confirm the current plan supports the model |
| Only one group has a low success rate | Group resource pool, plan permission, or upstream account issue | Switch group/model; when contacting support, provide the group name and time range |
Multiple groups show 502, 504, 521, 522, or 524 at the same time | Upstream or network path issue | Retry later and reduce long-running tasks; contact support if it persists |
Multiple requests show 413 | Request body is too large | Shorten context, split files, compress images, or reduce tool results |
Multiple requests show 429 | Request rate is too high, daily quota is exhausted, or credentials are cooling down | Reduce concurrency; distinguish RPM, daily limit, and cooldown from the log |
4. Combine cost and cache data
| Symptom | More likely cause | What to do |
|---|---|---|
| Cost is clearly higher than other tokens in the same group | Large context, long output, high-frequency calls, or repeated tasks | Combine Requests, Avg Latency, and error logs to locate the service or member |
| Cache Hit Rate is high but Cache Request Share is low | A small number of large requests hit cache | Check whether only fixed tasks are reusing context |
| Cache Request Share is high but Avg Cache Tokens is low | Many requests hit cache, but each hit saves little | Check whether context is too short or cache content is unstable |
| One token has clearly higher Avg Latency | Heavy client tasks, long context, long output, or slow upstream | Compare that token's Requests, cache data, Failure Reason, and single logs |
Information for Support
For simple issues, check Error Logs and Group Health first. If the issue remains unresolved, open the error log details in console/log and click the copy icon to copy the troubleshooting details in one click. When contacting support, provide the following in one message so the technical team can investigate with less back-and-forth:
- User ID
- Time range: when the issue started and when it last appeared
- Group name:
group - Model name used by the request
- Status code, such as
429,413,502, or503 - Error content:
error_reasons.content - Request ID:
request_idfrom a single log entry or API response - Impact scope: one token, one model, one group, or multiple groups at the same time
Quick summary
For 401 / 403, check permissions. For 413, check request body size. For 429, check rate and quota. For 502 / 504 / 524, check upstream and long-running tasks. For 503, check whether resources are temporarily unavailable.